 Web Grids
 Web Grids
![]()
Table of Contents.
Here is the comparrison results:
Non Object Oriented / Object Oriented VS. Application / Development Tool
Non Graphical / Graphical VS. Target On Overall System / Target On Interface
Multi Media Application / Non Multi Media VS. System Tool / Human-oriented Tool
Expensive / Cheap VS. Novel Communication / Conventional Communications
Networked Application / Non Networked VS. Application / Development Tool
No Games / Games VS. Conventional Communication / Novel Communication
Part I
Desrciption of Grid Created
The grid created
was based on proffesional sports. I used elements such as Volleyball,
Basketball, Boxing, Hockey, Football, Soccer, Handball, and
Golf. These are all a variety of sports that contrast in many ways. So
for the constructs I used high/low pay, indoor/outdoor sport,
team/individual sport, seies/match sport, and contact/non contact sports.
Here is the display of the grid results: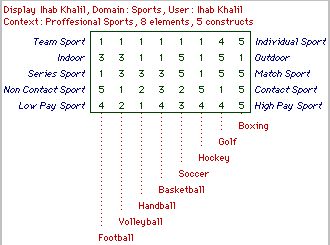
Comments on Initial Impressions
I found the web grid quite
easy to use. Although most matches of sports and constructs were very
accurate, I found the description of the functions to be very hard to
understand ex: "PrinCom". The graphs were pretty accurate although my
sports and constructs were pretty well very dispurse.
Here is the link to the WEB Grid
![]()
Part II
Developing Constructs
I constructed my constructs using the triad function which I found to
be quite hard since the elements picked by this function are sometimes
irrelivant of each other and may contain no main contrast in one of
the three. I constructed in total six constructs which seemed quite
suffecient with ten elements.
Description Of The Grid
The grid produced is using the cpsc
547 topics presented as elements and all the constructs are created by
using the triad function. The elements include: Electronic Publishing,
Virtual Reality, Multimedia and HyperMedia, Visual Programming, Cross
Platform GUI, Object Oriented Systems, Knowlege Based Systems, Digital
Libraries, Information Highways, and Broad Band Networks. The
constructs used in the grid are graphical/non graphical, multimedia,
object oriented, networked, games, and price.
Here is the
display of the grid results: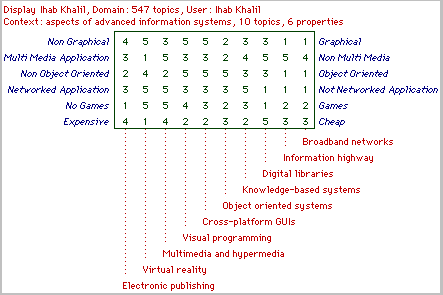
Comparrisons Of The Grids
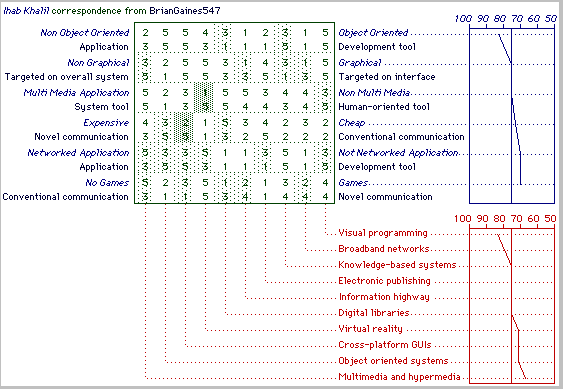
Contrast -- Both terminology and destinction are completly different. My constructs were attributes of an application, Dr. Gaines' were diffrent types of applications.
Contrast -- Both terminology and destinction are completly different. My constructs were attributes of an application, Dr. Gaines' were looks of application.
Contrast -- Both terminology and destinction are completly different. My constructs were attributes of an application, Dr. Gaines' were looks of application.
Correspondence -- Both terminology are diffrent but the distinction is the same because my constructs are attributes of Dr. Gaines'.
Conflict -- Both terminology are the same and destinction are completly different. My constructs were attributes of an application.
Contrast -- Both terminology and destinction are completly different.Here is the link to the WEB Grid
![]()
Part III
Desrciption of Grid Created
The grid created
was based on object oriented systems. For my elements, I used obect
oriented programming, object oriented databases, object oriented
operating systems, object linking and embedding, object oriented
graphics systems, and object oriented desktop systems. These are all a
variety of sports that contrast in many ways. So for the constructs I
used programmin/mon programming language, cheap/expensive, Easy/Hard
to use, multi/single platform, and user/programmer
software.
Here is the display of the grid results: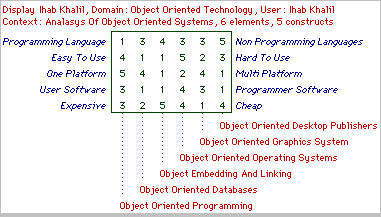
Analasys Of The Grid
The matching of elements and constructs
is fairly accurate. Object Oriented Desktop Publishers and Object
Linking and Embedding match with 80%. This is accurate since both of
them are overlapping in many ways. The constructs got matched with
easy to use and user software, which is pretty accurate sice user
software is usually very user friendly. The rest of the matches made
are not really accurate but they are close.
Focus -- This displays all the elements in a chart with the value of
the constructs to each element. As we can see the closely related
elements will be the same color as the others. For example: Object
oriented programming and operating systems are both hard to use and
they are both the same color.
Here is the display of the focus
graph: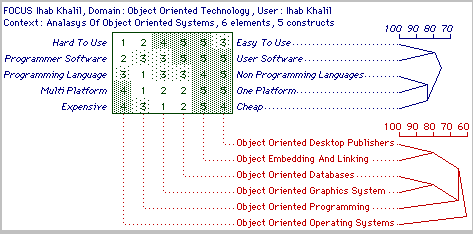
Princom -- This displays on an axis the
elements with the constructs as lines on top of the axis. This gives
us a good idea of what is closely related and what is not. For
example, OLE and Object Oriented Desktop Publishers are on the left
middle side and the object oriented programming is on the opposite
side which makes sence since they are very diffrent elements.
Here
is the display of the princom graph: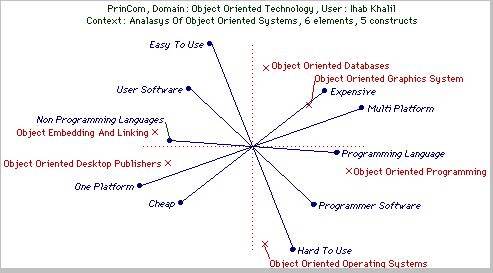
Here is the link to the WEB Grid
![]()
Conclusion (Web Grids)
Web Grid is a vey simple and helpfut
tool used on the internet. I found it to be very good for making
comparrisons and matching diffrent elements with certain
constructs. It is essential to be consistent with the ratings in order
to get the best comparrison analasys.